
Conventional wisdom holds that stocks and home prices are independent. Tuning into CNBC in the morning to watch the S&P 500 chart wiggle around should have nothing to do with the price of the home in which you’re sitting in pajamas doing the watching. It turns out that if you’re the kind of person who really cares about stocks, your home’s price is probably much more closely linked to those stocks than you think.
A common saying is that all real estate is local. That’s how Wall Street was able to package trillions of dollars of Mortgage-Backed Securities (MBS) and sell them as low-risk bonds; on the premise that homes from different geographic locations would be uncorrelated to each other. With the housing crash of ’08 that premise was turned upside down. Massive national and global financial forces tore through the idea that housing is local, but truth tends to find middle ground.
Research shows that the wealthier the neighborhood, the more sensitive are its home prices to the fluctuation of the stock market. When it comes to home prices and stocks, housing is neither a fully national phenomenon, nor a purely local one. Homes are influenced by stocks, which are a reflection of household wealth.
Manhattan Beach is an affluent Southern California city with median household income registering more than twice the national average. Higher income means residents have more financial assets than the national average, linking wealth more closely to the ups and downs of stocks. As a test case for investigating these phenomena, Manhattan Beach was compared to neighboring Los Angeles, and to the national housing market.
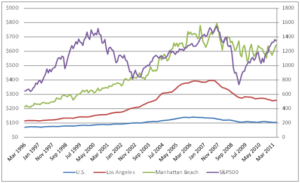
Simply eye-balling a ten year chart of home and stock prices isn’t clear one way or another. The period from 1996 to 2007 showed almost constant growth in home prices, while the stock market seesawed. Some math is involved to really see what’s going on.
The mathematical method for measuring sensitivity of one asset to another is to calculate the “beta” of that asset to the benchmark against which you’re comparing. Beta ranges from -1 to +1, with values close to zero meaning there’s no statistical correlation.
It turns out that home prices, in general, are not very sensitive to stocks. U.S. home prices have a beta of 0.04, meaning that if the S&P 500 were to jump 10% we would, on average, see national median home prices increase 4 tenths of 1%. From a finance perspective, a 0.04 beta implies essentially zero correlation.
Midwestern farm communities and sleepy southern towns might not see home prices move much with the stock market, but the story changes quite a bit for big cities, like Los Angeles. LA has a beta of 0.18, meaning that a 10% move in the S&P 500 would produce a corresponding 1.8% move up in home prices. Given that home purchases are typically highly leveraged, with only 5% to 20% equity invested, small price movements have a big impact on household wealth.
Manhattan Beach home prices blow both out of the water, with a beta of 0.33. For every 10% increase in the S&P 500 Manhattan Beach homeowners see a 3.3% increase in home prices. For new buyers with 20% equity in their homes, a 3.3% gain translates to a 16% return on equity.
To keep things in perspective, a beta of 0.33 is not earth shattering, especially when compared to the beta of a popular stock like Apple, which is 1.11. What’s surprising is that there is any correlation at all between home prices and stocks, and that that correlation tends to depend on relative homeowner wealth.
What this means for homeowners in affluent cities is that they need to start considering their residences as part of their financial portfolios. The goal of wealth preservation in portfolio theory is to minimize the correlation of assets, so that when one, or a few, declines your overall portfolio should be insulated. If your home takes a dive with the stock market, the impact on overall net worth is amplified. Consider hedging strategies, or, at a minimum, take a fresh look at asset allocations.


We love your feedback and welcome your comments.
Please post below: